Personalized Tutoring, On-demand
Delivered by carefully selected professionals that best fit your child’s needs
Meet our Tutors

Oyindamola Ajewole
English Language

Rachel Abaire
English Language

Adebowale Yekini
Physics

Ezekiel Arinola
Mathematics

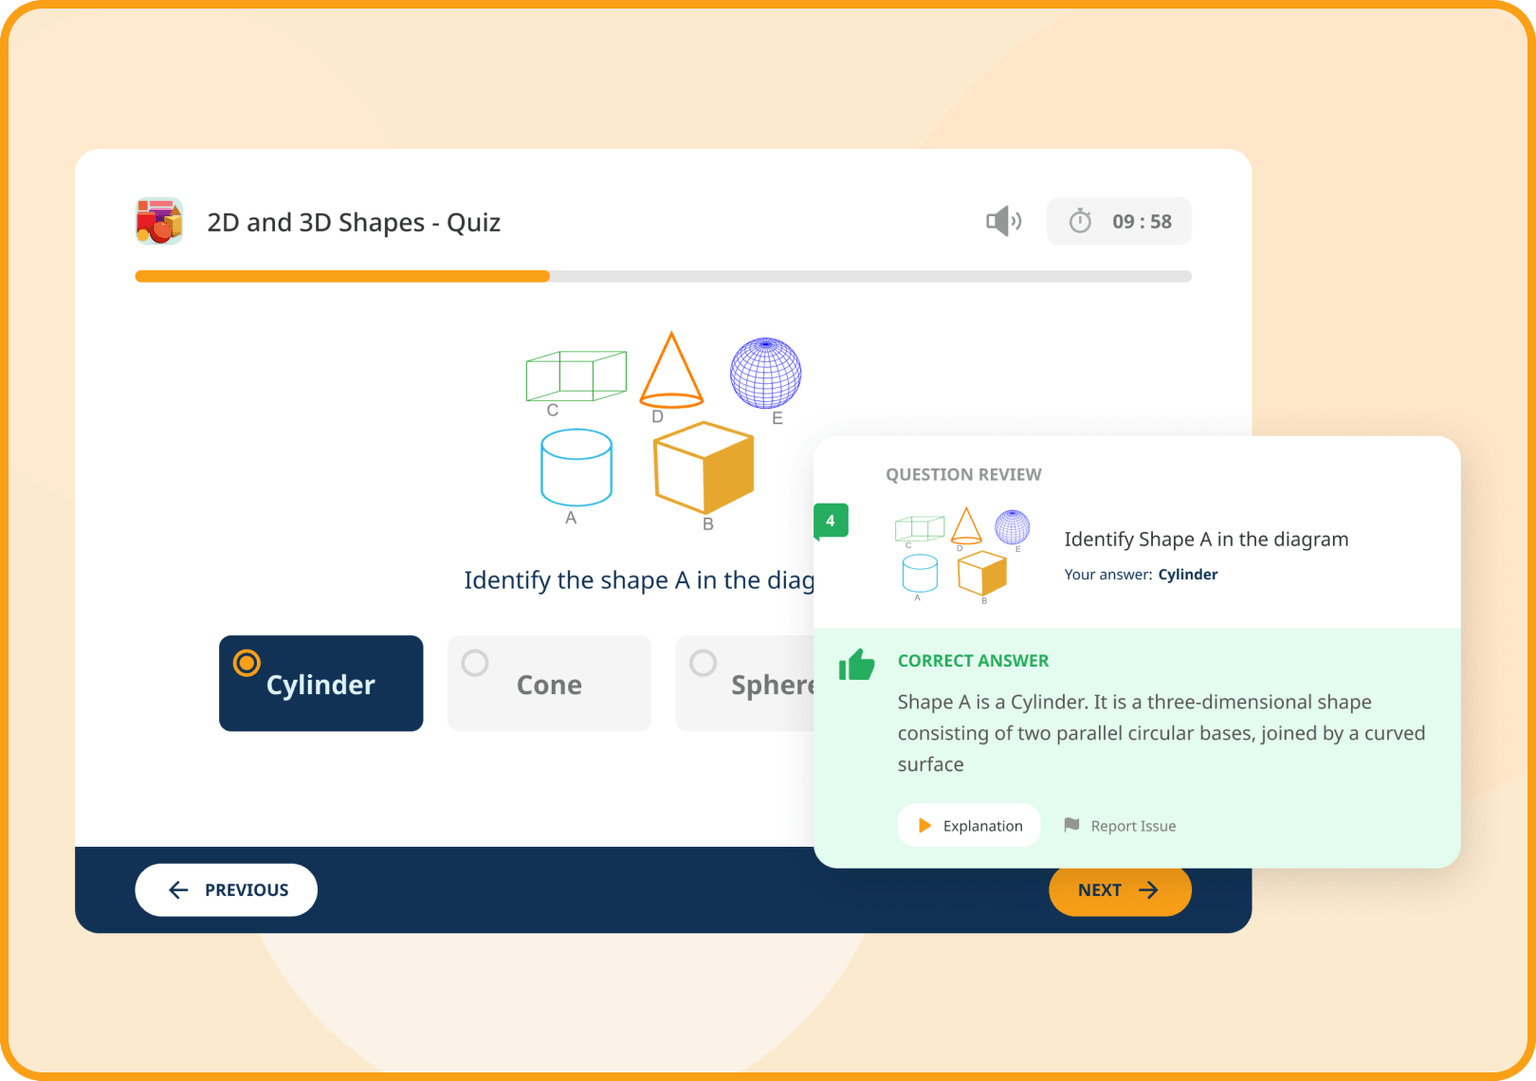
Assess
Gradely uses curriculum aligned assessments and technology to detect your child's learning gap and tailor live classes and other resources to address this

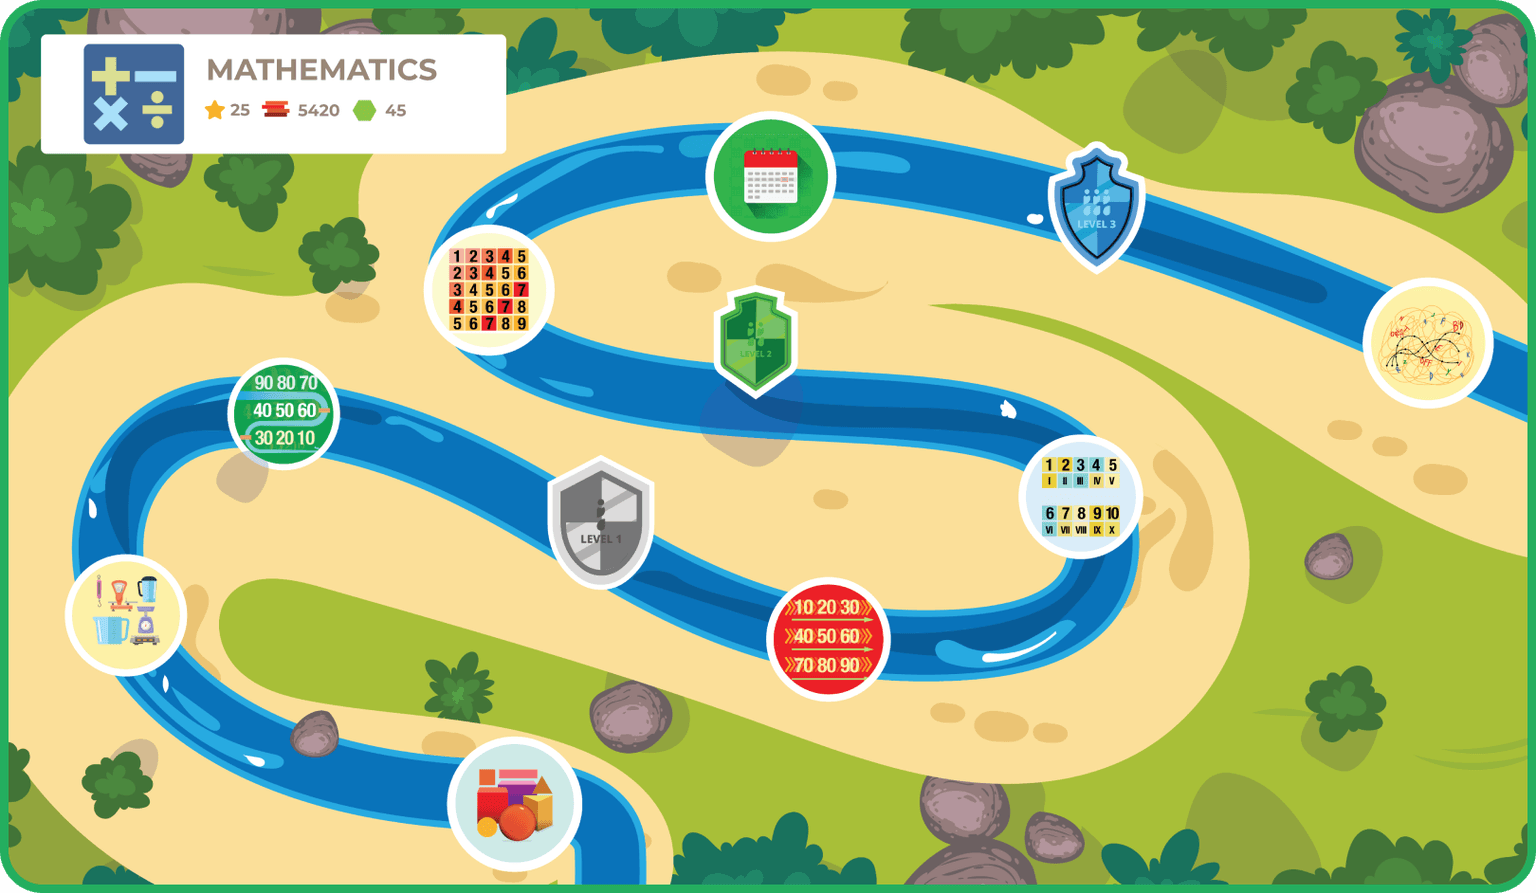
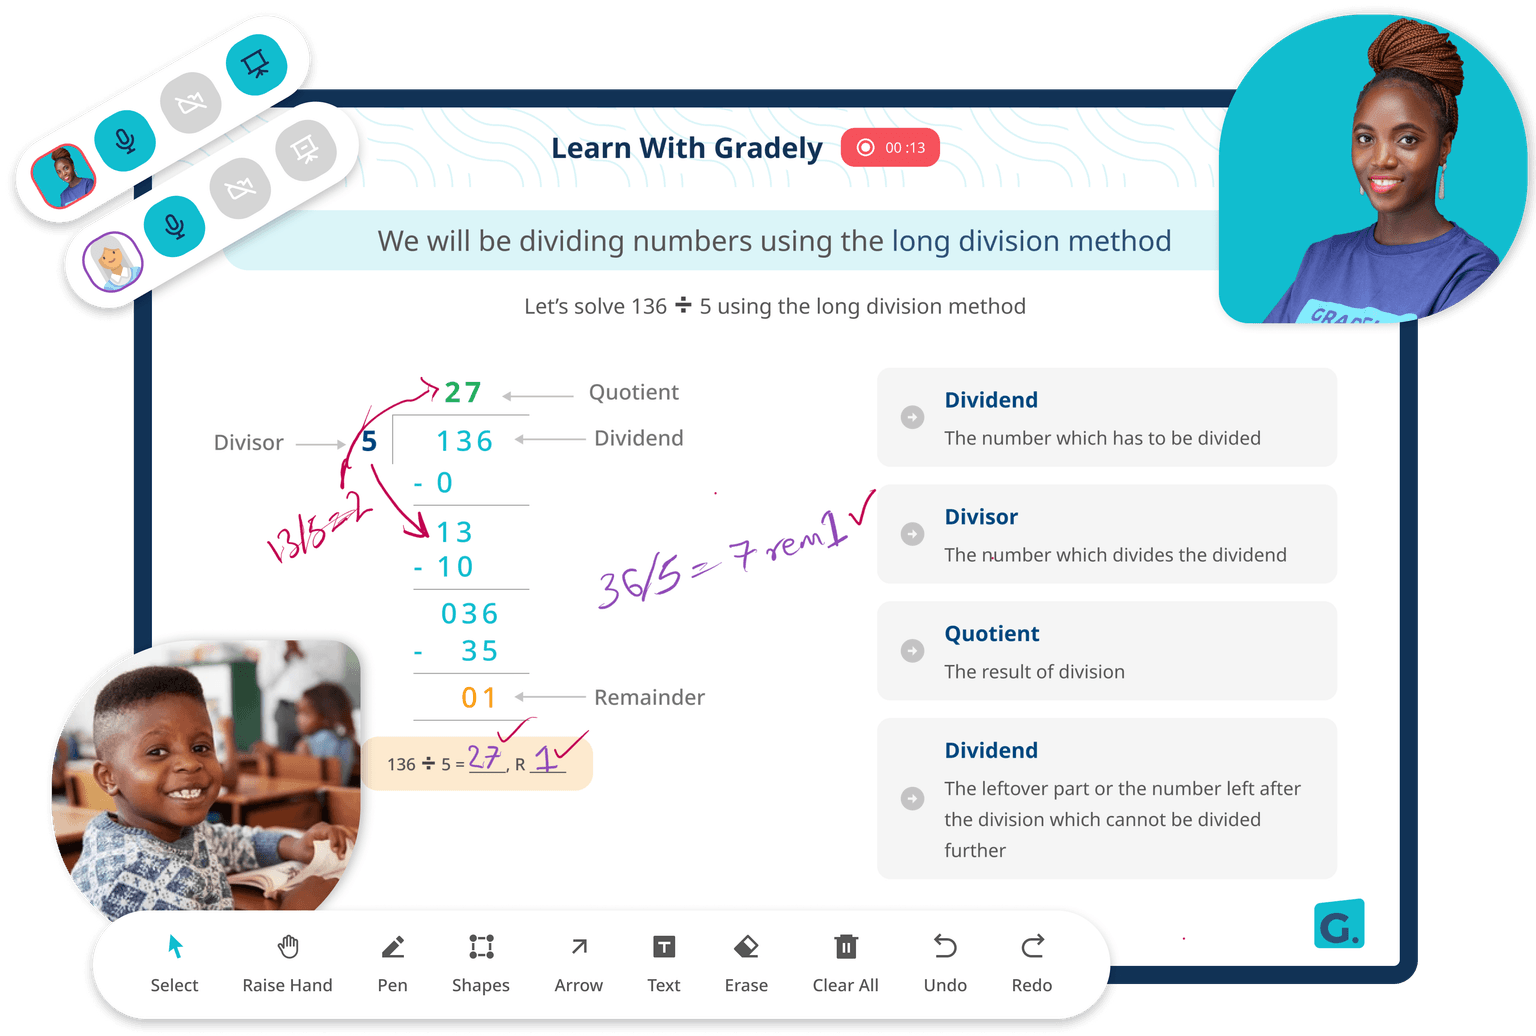
Learn
Personalised 1-on-1 live classes supported by learning resources and practice recommendations

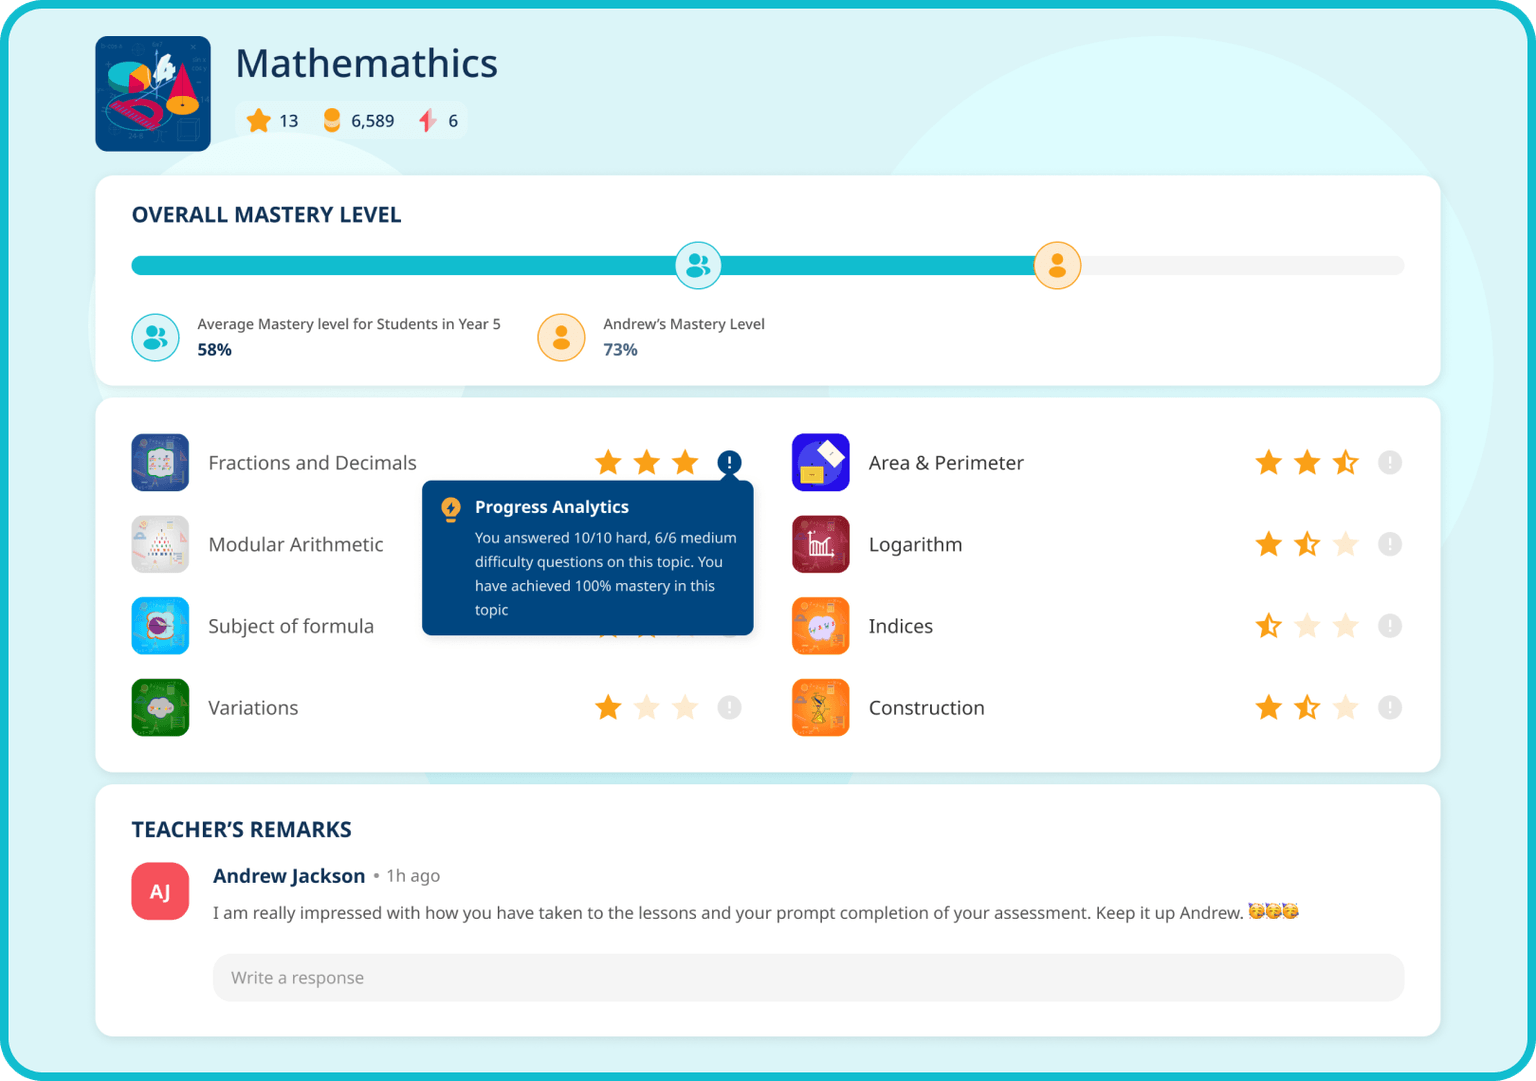
Track
See your child's progress on a weekly basis. Live classes are recorded for reviews and your child can always reconnect to every past learning experience.
School Curriculum & Key Stages
Experienced tutors in the UK National Curriculum from Key stage 2 to A levels
What parents say about Gradely

Mayokun
Newport Southwales, UK

Fikayo
Newport Southwales, UK

Alexandra
Lagos, Nigeria

Godsvoice
Lagos, Nigeria

Oluwayanmife
Lagos, Nigeria

Chiwete
Lagos, Nigeria

Mayokun
Newport Southwales, UK

Fikayo
Newport Southwales, UK

Alexandra
Lagos, Nigeria

Godsvoice
Lagos, Nigeria

Oluwayanmife
Lagos, Nigeria

Chiwete
Lagos, Nigeria

Mayokun
Newport Southwales, UK

Fikayo
Newport Southwales, UK

Alexandra
Lagos, Nigeria

Godsvoice
Lagos, Nigeria

Oluwayanmife
Lagos, Nigeria

Chiwete
Lagos, Nigeria
Frequently Asked Questions
- Are the classes live or pre-recorded?
- Which age range do you cover?
- Which accessories do I need for the classes?
- Which exams do you prepare kids for?
- Which resources do you use for your exam preps?
- Which subjects do you cover?
- What is the rate of your classes?


